PuckCast Edge
Every pick is free. The Edge is the rest.
Betting edges, stake sizing, props priced against the line, fantasy tiers and the graded ledger. $14.99 a month in season, or $99 for the year.
PuckCast Edge
Betting edges, stake sizing, props priced against the line, fantasy tiers and the graded ledger. $14.99 a month in season, or $99 for the year.

 Left Wing•#12PPI 66
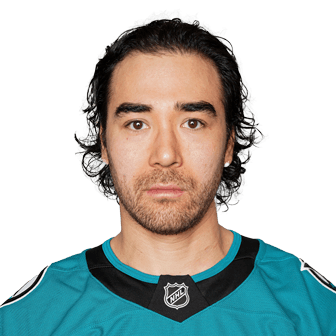
Trevor Moore is a 31-year-old left wing for the Los Angeles Kings. Born in Thousand Oaks, USA.
This season, the left-shooting forward has 2 goals and 3 assists for 5 points in 13 games. He averages 0.38 points per game on 16:37 of ice time.
2026-27 · Regular season
2026-27 projection
Projected September 28, 2026 — 80% range on points. All 2026-27 player projections
80% range: 16–49 pts
2026-27 · Regular season
Full statistical breakdown for the 2026-27 regular season.
League percentile
Vs. all NHL skaters, 10+ games played. 99 = best, 1 = lowest.
2026-27 pace
Where Trevor's current rate finishes the 2026-27 season.
End of season forecast, current pace
68
games remaining
Goals
12
Current: 2
Assists
19
Current: 3
Points
31
Current: 5
Limited offensive production projected. Expected range of 17-45 points based on current usage patterns.
0.0%
Art Ross
Most Points
0.0%
Rocket
Most Goals
0.0%
Playmaker
Most Assists
Projections based on current pace extrapolated to the full season with variance modeling.
5v5
What happened while Trevor was on the ice at 5v5, and who he was sent out against. 2026-27.
5v5 only (situationCode 1551), unblocked attempts, shift-chart attribution. 13 games, 237 unblocked attempts on the ice.
Quality of competition
64.8 vs 57.3 lg
98th percentile
Quality of teammates
53.1 vs 56.8 lg
39th percentile
Deployment
tough-comp
by competition faced
Competition and teammate quality are the average on-ice strength of the players he shared the ice with at 5v5, on the same 0–100 scale as the league averages beside them.
Shot Selection
Where Trevor takes his shots, and how each zone converts.
Unblocked attempts
34
Goals vs expected
2 vs 1.8 xG
5v5 scoring-chance share
26%
2026-27
PuckCast Player Intelligence, and the skill radar and on-ice impact behind it.
Skill radar & on-ice impact vs. NHL forwards
56
Offense
21
Defense
Percentile ranks across 6 skill dimensions. Larger shape = more complete player.
Scouting Take
Displays a heavy penalty-kill workload. Areas for improvement: bleeds goals against at evens.
On-ice impact mirrored side by side. Equal bars = balanced. Asymmetry = one-dimensional.
The Gap
35-pt spreadThe 35-point spread between offensive (56th) and defensive (21th) percentiles is significant for a winger. Elite offensive creation but defensive liability.
Percentile ranks across 6 skill dimensions.
Scouting Take
Displays a heavy penalty-kill workload. Areas for improvement: bleeds goals against at evens.
On-ice impact mirrored side by side.
The Gap
35-pt spreadThe 35-point spread between offensive (56th) and defensive (21th) percentiles is significant for a winger. Elite offensive creation but defensive liability.
Career
Season-by-season NHL regular season statistics throughout Trevor Moore's career.
| Season | Team | GP | G | A | P | +/- | S | S% | PIM | PPG | TOI/G |
|---|---|---|---|---|---|---|---|---|---|---|---|
| 26-272026-27 | LAK | 13 | 2 | 3 | 5 | -4 | 26 | 7.7% | |||
| 25-262025-26 | LAK | 69 | 13 | 19 | 32 | 0 | 159 | 8.2% | |||
| 24-252024-25 | LAK | 71 | 18 | 22 | 40 | +17 | 153 | 11.8% |
Form
Trevor's last five games played — playoff games included if his team advanced, since the NHL does not separate them here.
| Date | Opp | G | A | P | +/- | S | TOI |
|---|---|---|---|---|---|---|---|
| Oct 31 | vs BUF | 0 | 1 | 1 | -1 | 3 | 18:30 |
| Oct 29 | vs OTT | 1 | 0 | 1 | -1 | 3 | 19:03 |
| Oct 27 | @ CHI | 0 | 0 | 0 | 0 | 2 | 17:51 |
| Oct 26 | @ NYR | 0 | 1 | 1 | +1 | 0 | 14:01 |
| Oct 24 | @ NJD | 0 | 0 | 0 | 0 | 1 | 15:43 |
Similar left wings
Same position, comparable 2026-27 projected rate and 2026-27 shot/power-play rate. Compare Trevor to another player
Roster
Top teammates by points on the Los Angeles Kings this season.
Bars are share of unblocked attempts, where he chooses to shoot, over a full season, which is the stable part. xG/100 compares his shot quality from a zone against the league rate for a forward. GAx is goals above expected there, a single season and noisy, zones marked * are flagged small-sample by the generator and are shown muted rather than hidden.
| 23-242023-24 | LAK | 82 | 31 | 26 | 57 | +11 | 244 | 12.7% |
| 22-232022-23 | LAK | 59 | 10 | 19 | 29 | -2 | 163 | 6.1% |
| 21-222021-22 | LAK | 81 | 17 | 31 | 48 | +20 | 202 | 8.4% |
| 20-212020-21 | LAK | 56 | 10 | 13 | 23 | -5 | 88 | 11.4% |
| 19-202019-20 | LAK | 15 | 3 | 2 | 5 | -1 | 19 | 15.8% |
| 19-202019-20 | TOR | 27 | 3 | 2 | 5 | -3 | 41 | 7.3% |
| 18-192018-19 | TOR | 25 | 2 | 6 | 8 | +1 | 26 | 7.7% |
| Career | — | 498 | 109 | 143 | 252 | +34 | 1121 | 9.7% |

Scott Laughton
C · 5 pts