PuckCast Edge
Every pick is free. The Edge is the rest.
Betting edges, stake sizing, props priced against the line, fantasy tiers and the graded ledger. $14.99 a month in season, or $99 for the year.
PuckCast Edge
Betting edges, stake sizing, props priced against the line, fantasy tiers and the graded ledger. $14.99 a month in season, or $99 for the year.

Central Division · Western Conference
| Date | Opponent | Rest | STL win |
|---|---|---|---|
| Nov 3 | at Rangers | 2 days | 47%Final pick |
| Nov 5 | at Devils | 1 day | 39%Model read |
| Nov 7 | at Predators | 1 day | 51%Model read |
| Nov 10 | vs Red Wings | 2 days | 56%Forecast |
| Nov 12 | at Mammoth | 1 day | 42%Forecast |
Final pick is the locked call for that night. Model read is today’s read for a game inside the next week and can still move. Forecast comes from preseason team ratings and is replaced by the model read as the game gets close. Rest is full days off since the team’s last game; B2B is the second night of a back-to-back. NHL back-to-back schedule →
6-8the model’s record on St. Louis Blues games.
St. Louis Blues is #15 at 56 (up 3 since Sep 7). Scale is 0 to 100; each point is one published Power Index reading.
42.9%
6 of 14 correct
Bottom 3 of 32: the model has struggled to read this team. Take the picks here with extra caution. Full track record →
Each ring is one round deeper, so every number sits inside the one outside it. From 20,000 simulated seasons, before any games were played.
+0.1
Special teams edge
PP 0.2% · PK 0.8%
0.5%
Faceoff win rate
+0.33
Luck score (PDO 101.2)
Near expectation
31.1
Hits + blocks / game
19.5 hits · 11.6 blocks
Percentile rankings vs. all 32 NHL teams
48
Offense
68
Defense
53
Overall
Percentile ranks across 8 dimensions. Larger shape = more complete team.
Scouting Take
The St. Louis Blues profile as a middle-of-the-pack club still searching for a clear identity. A solid regulation win rate suggests they can close out games. Recent form is middling, treading water.
Every metric ranked vs. the league, sorted best to worst. Long bar = advantage.
Key Takeaway
Reg Wins (74th) and Defense (68th) stand out as above-average. Exposed in road (26th) and hits (23th) and blocks (6th). Opponents will target these areas.
Rank out of 32 teams in each category.
3.14 GPG
3.00 GA/G
+2
53.6%
7 RW in 14 GP
6-4-0
4-2-1
3-4-0
Upcoming

@ Rangers
7:00 PM ET • Madison Square Garden
7-7-1 (15 pts)
Win Prob
47%
Model Edge
-2.7
STL Starter
NYR Starter
Underlying
| Strength | CF% | FF% | xGF% | xGF | xGA | GF | GA | PDO |
|---|---|---|---|---|---|---|---|---|
| 5v5 | 49.5 | 47.0 | 49.9 | 28.9 | 28.9 | 27 | 31 | 99.3 |
| Power play | 79.4 | 74.0 | 84.8 | 7.0 | 1.3 | 8 | 1 | 113.2 |
| Penalty kill | 17.9 | 23.3 | 19.1 | 1.3 | 5.7 | 3 | 4 | 112.9 |
| All strengths | 49.4 | 47.4 | 51.4 | 40.2 | 38.1 | 44 | 42 | 101.2 |
14 games. Corsi (CF%) and Fenwick (FF%) are shot-attempt shares; xGF% weights those attempts by chance quality. PDO is shooting plus save percentage × 10. It regresses hard toward 100, so a team far from it is usually running hot or cold rather than good or bad. Percentages are coloured against break-even at even strength only; special teams are lopsided by definition. These are raw, unadjusted totals: no score, venue or schedule adjustment.
Roster
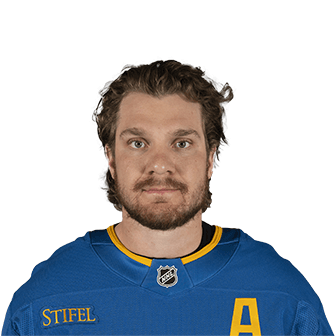
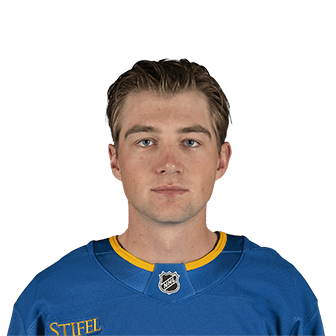
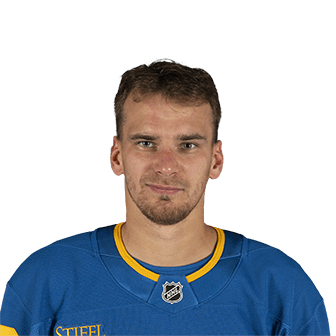
Player Intelligence
League board →60
Overall Quality
86% Full Strength
-9 injury impact
86
Top Line
83
Top Pair
82
Starter
Standings